Dice & probability
2d6 vs 1d12: Dice Probabilities Explained Visually
Two six-sided dice and one twelve-sided die can both reach twelve, but their totals behave differently. Count the ways to make each total before comparing the odds.
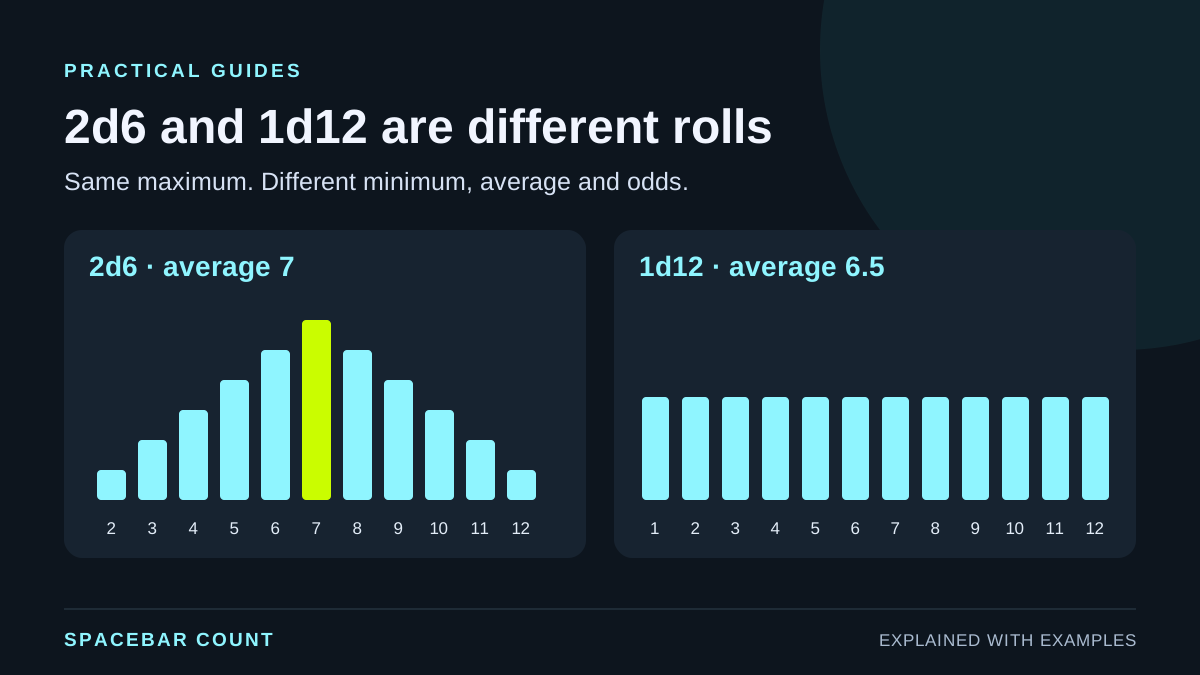
The short answer: 2d6 clusters around seven
2d6: totals 2–12, average 7, and a 1-in-6 chance of exactly 7. 1d12: totals 1–12, average 6.5, and a 1-in-12 chance of each face. These assume fair, independent dice.
The notation 2d6 means roll two six-sided dice and add their values. The notation 1d12 means roll one twelve-sided die. Their maximums match, but their minimums, averages and distributions do not.
| Measure | 2d6 | 1d12 |
|---|---|---|
| Minimum | 2 | 1 |
| Maximum | 12 | 12 |
| Average | 7 | 6.5 |
| Exactly 7 | 6/36 = 16.67% | 1/12 = 8.33% |
| Exactly 12 | 1/36 = 2.78% | 1/12 = 8.33% |
| Total 6, 7 or 8 | 16/36 = 44.44% | 3/12 = 25% |
Use the distribution that matches your game’s rule. Replacing one roll with the other changes more than the chance of a high number; it changes which middle results occur most often.
Count matching outcomes, not only totals
Explore the exact dice odds
Choose a roll, a target and whether you mean exactly or at least. Each highlighted cell is one equally likely ordered outcome.
6 of 36 outcomes equal 7.
Six different ordered pairs make 7.
Highlighted cells match the chosen condition. These are counted outcomes, not a simulated sample.
2d6 equals 7 in 6 of 36 ordered outcomes: 16.6667%.
The dice are distinguishable for counting: first die 1 and
second die 6 is a different ordered outcome from first die 6 and
second die 1. Both have a total of seven. There are six choices
for the first face and six for the second, giving
6 × 6 = 36 equally likely ordered outcomes.
For seven, the pairs are (1,6), (2,5), (3,4), (4,3), (5,2) and (6,1). For twelve, only (6,6) qualifies. Counting just the eleven possible totals and treating them equally would give the wrong answer.
The two-dice probability chart
| 2d6 total | Ordered outcomes | Probability |
|---|---|---|
| 2 | 1 of 36 | 2.78% |
| 3 | 2 of 36 | 5.56% |
| 4 | 3 of 36 | 8.33% |
| 5 | 4 of 36 | 11.11% |
| 6 | 5 of 36 | 13.89% |
| 7 | 6 of 36 | 16.67% |
| 8 | 5 of 36 | 13.89% |
| 9 | 4 of 36 | 11.11% |
| 10 | 3 of 36 | 8.33% |
| 11 | 2 of 36 | 5.56% |
| 12 | 1 of 36 | 2.78% |
The counts rise from one to six, then fall back to one. Their sum is 36. This triangular shape is an exact count, not an estimate from rolling the dice many times.
A short run of actual rolls can look uneven. It need not produce each face or total in its theoretical proportion. If you compare a simulated histogram with this chart, keep the sample size visible and separate observed frequency from exact probability.
Exactly, at least and above mean different things
For at least 7 on 2d6, count totals 7 through
12: 6 + 5 + 4 + 3 + 2 + 1 = 21. The chance is
21/36 = 58.33%. For above 7, leave
seven out: 15/36 = 41.67%.
For 1d12, at least seven includes six faces, giving
6/12 = 50%. Above seven includes five faces, giving
5/12 = 41.67%. One comparison can happen to match
even when the full distributions differ.
Write the condition before calculating. “Roll a seven,” “roll seven or higher” and “beat seven” are different events. The interactive chart uses “At least” to include the target itself.
Compare both rolls in the dice roller
- Open the dice roller.
- Select D6, set Number of dice to 2, and use Add to roll. Keep any other dice out of this comparison.
- Optionally name the two dice First and Second, then roll and add their individual values.
- Clear that pool, add one D12 and compare its single-face result.
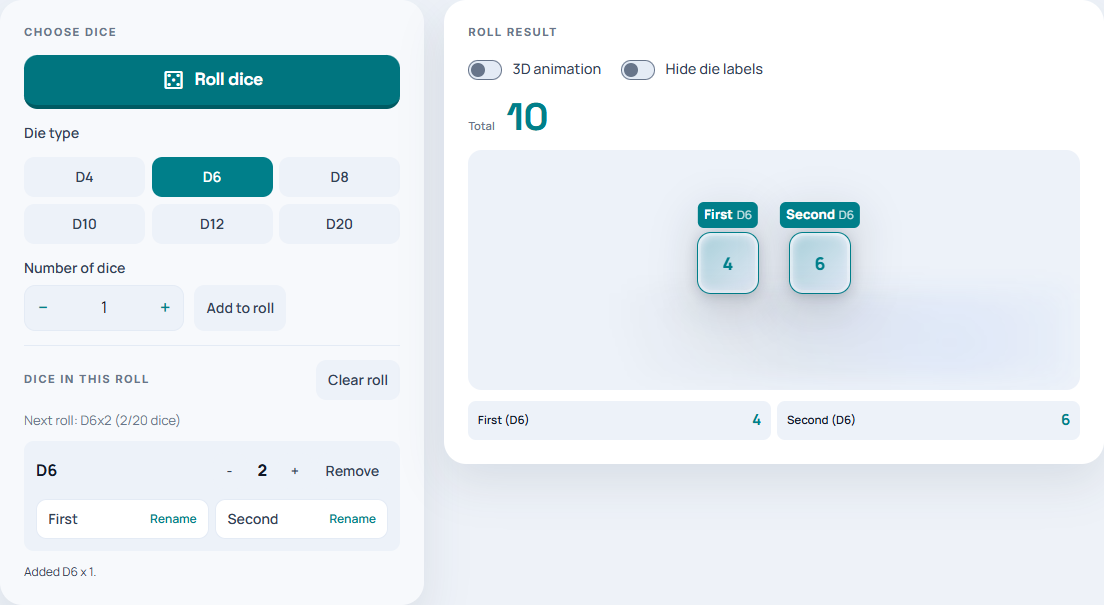
For mixed types or named game actions, follow the mixed dice and labels guide. The roller’s arithmetic total does not apply rules such as keeping only the higher die.
What this comparison does and does not establish
These probabilities assume each die face is equally likely and the dice do not affect one another. A distribution chart does not test a physical die for bias, and one unexpected run is not proof of a faulty generator.
The difference also matters beyond these two rolls: adding multiple independent dice generally produces a different shape from reading a single die with a similar maximum. Define the dice, how their values are combined and the target event first.
For a related example of several equally likely sequences producing different event probabilities, see the coin-flip probability comparison.